Flow analytics
A self-hosted NetFlow, IPFIX and sFlow analyzer
Heimnull collects flow data from the routers and switches you already run and turns it into a live view of your network: every second, by host, prefix, ASN, application and country. It runs on one Linux server, and your flow data never leaves it.
Every format, on every port
Point your exporters at the server and they appear within seconds, approved automatically or waiting for you. Every listening port accepts every format, so a router sending IPFIX to the NetFlow port still works.
Heimnull identifies each exporter by its source address and keeps its templates across restarts, so data decodes straight away after an upgrade instead of waiting for the router to send them again.
| Format | Default port | Typical exporters |
|---|---|---|
| NetFlow v9 | 2055/udp | Routers and firewalls with a flow cache, such as MikroTik RouterOS and Juniper SRX |
| IPFIX | 4739/udp | Juniper MX inline monitoring (packet samples), and IPFIX flow exporters |
| sFlow v5 | 6343/udp | Switches such as the Juniper EX series |
Sampled data, counted correctly
Most routers sample, one packet in 512 for example. A flow analyzer is only as good as the way it scales and times those samples.
Sampling rates, detected
Heimnull reads each exporter's rate wherever it is sent: in an options template (Juniper MX) or in every record (MikroTik). Bytes and packets are scaled as they arrive. You can also set a rate by hand, and the exporter page warns when the detected and configured rates differ.
Packet samples, decoded
Juniper inline monitoring and sFlow send sampled packets, not flows. Heimnull parses each packet's header (Ethernet, VLANs and MPLS, IPv4 and IPv6 with extension headers, TCP, UDP, ICMP and fragments), so there's no flow-cache timeout to wait for and Live updates within about a second.
Late records, at their real rate
Flow caches report a flow only once it ends or times out. Records that arrive late are counted from their arrival at their own rate, so a long download never shows up as a spike and late traffic still counts.
Merged packets, recounted
Some routers count packets after the kernel merges them (MikroTik RouterOS 7 does), so a busy download can show a third of its real packet rate. Heimnull recounts those records from their bytes, so packets per second stay true.
What you can see
The same data drives every view, including detection, so the graph you look at is the number an attack was judged on.
Live
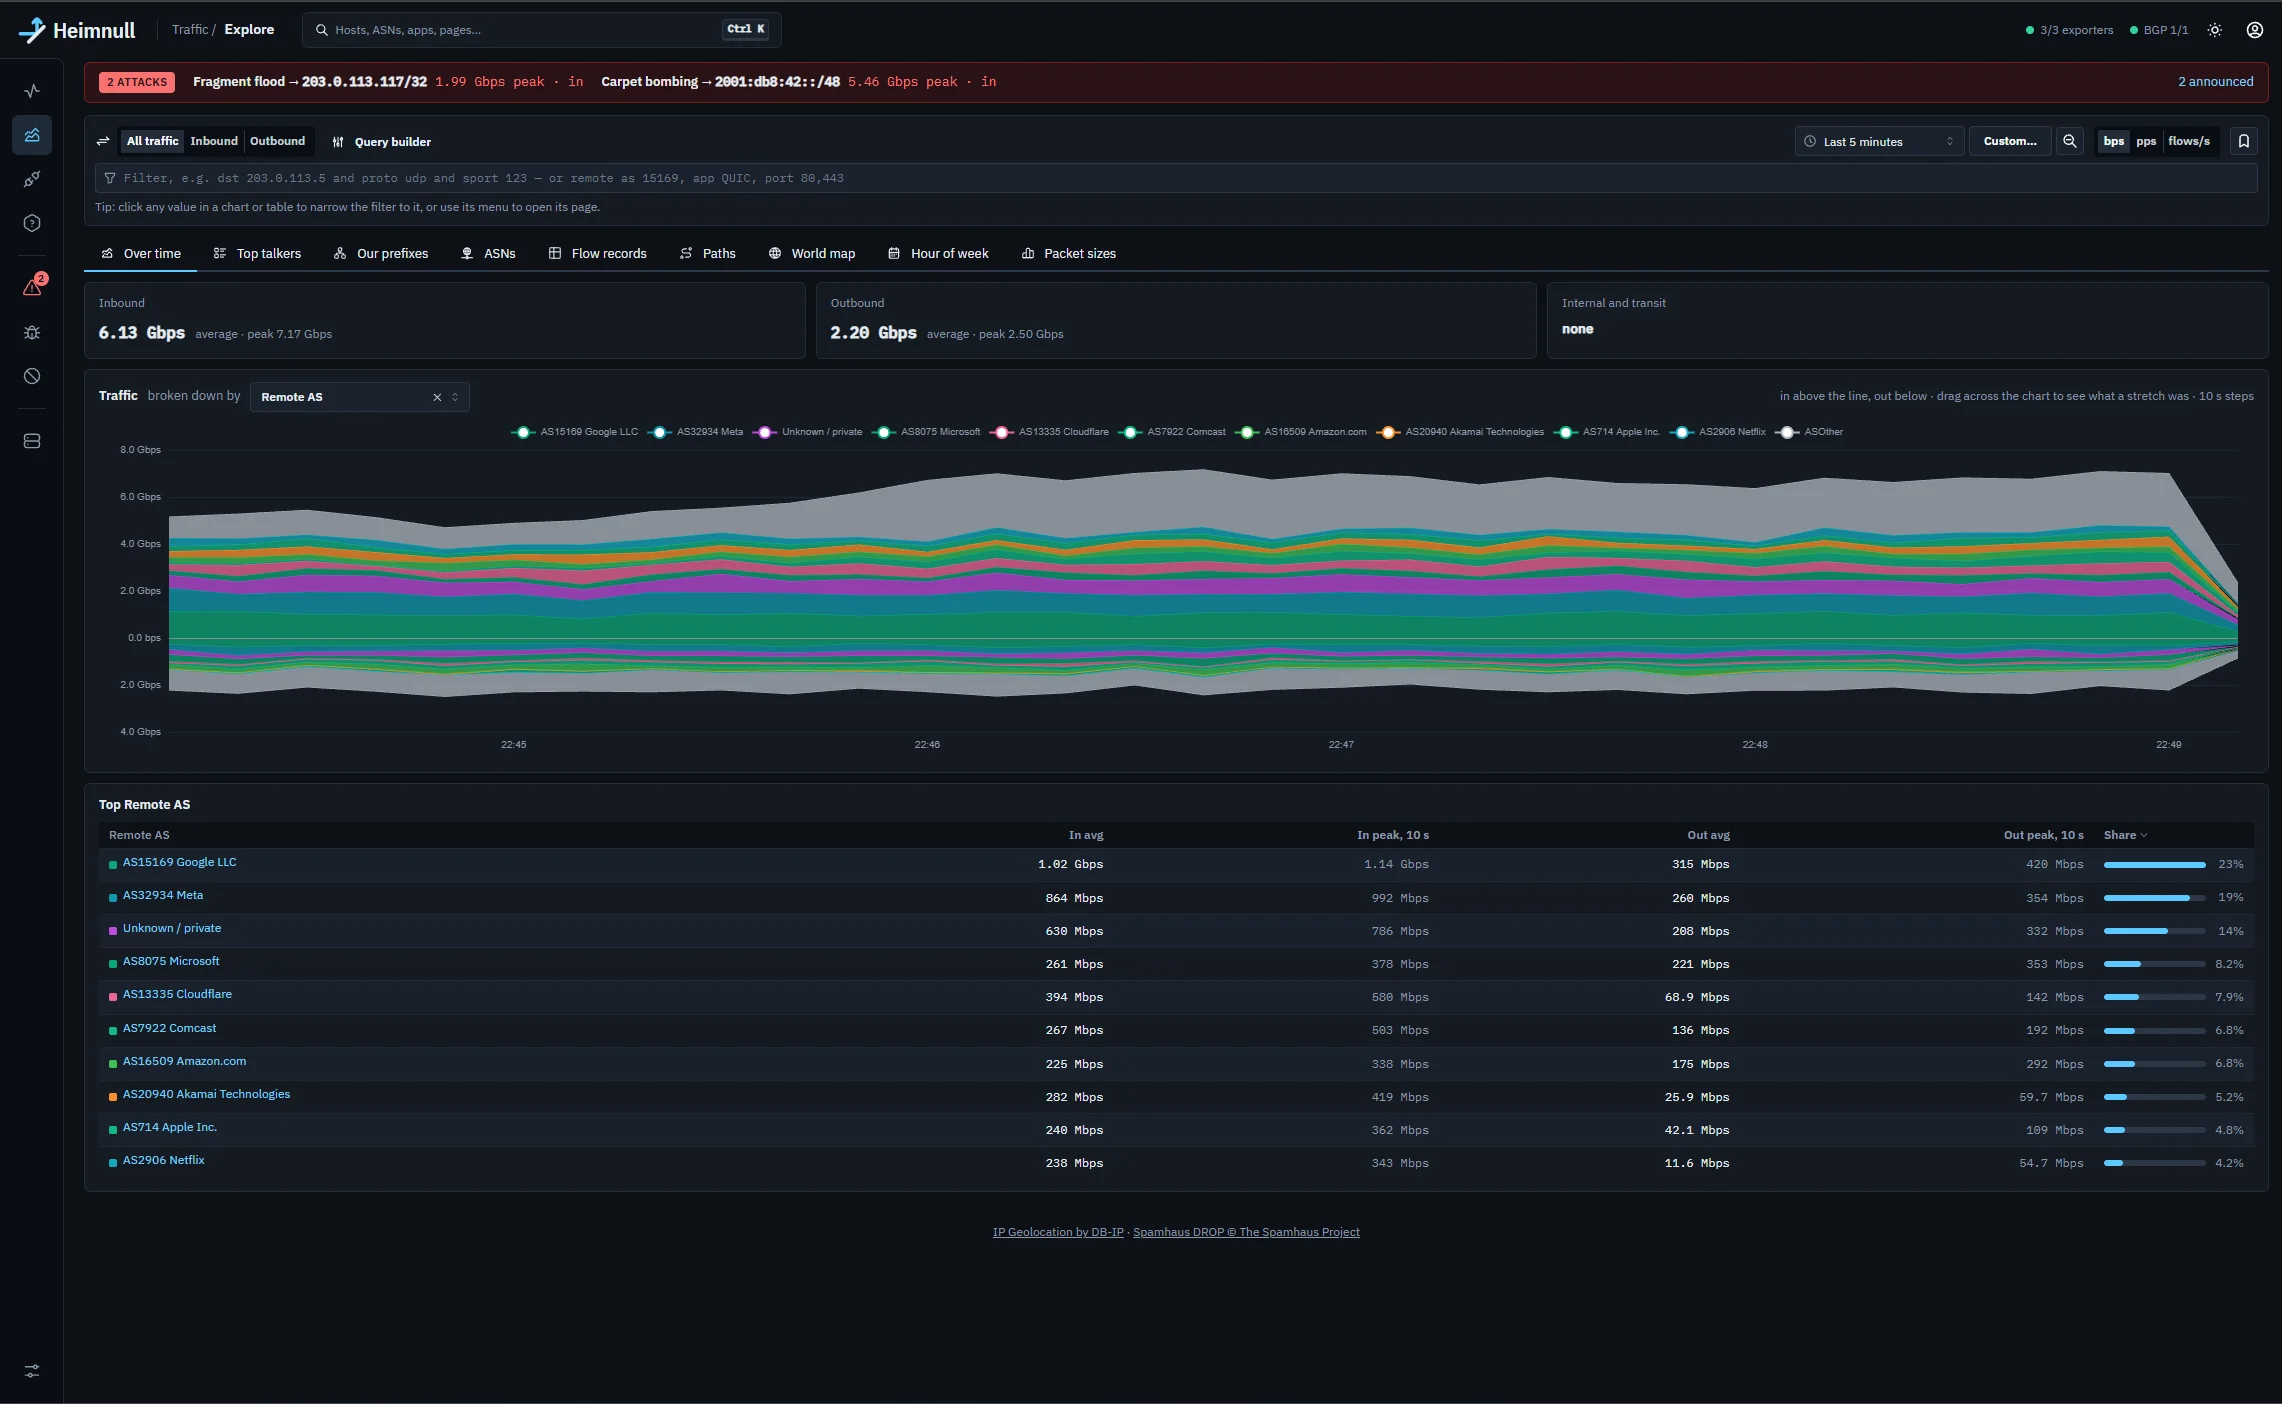
Per-second figures for traffic in and out, packets, flows, identified traffic, active hosts, attacks and announced routes, with top hosts, ASNs, applications, uplinks and countries.
Explore
One filter and a time range, then any view: over time, top talkers, your prefixes, ASNs, AS paths, flow records, a world map, hour of week and packet sizes.
Filters you can type
Write dst 203.0.113.5 and proto udp and sport 123, or remote as 15169, or build the same with the query builder. Click any value in a chart to narrow to it.
A page for everything
Every host, ASN, prefix, country, application, interface and exporter has its own page. Ctrl+K finds any of them.
Applications, named
Traffic is labelled from provider IP ranges, ASN services, reverse DNS, traffic-shape refinements and your own rules, in both directions.
Interfaces and SNMP
Interface counters from SNMP beside the flow estimate, with 95th percentiles and errors, and each uplink against its capacity.
Also built in: traffic from Spamhaus DROP, Feodo Tracker, ThreatFox and Tor exit addresses is flagged, and the internal host behind a NAT address is found from flow records or from Juniper SRX session logs.
Down to single flows
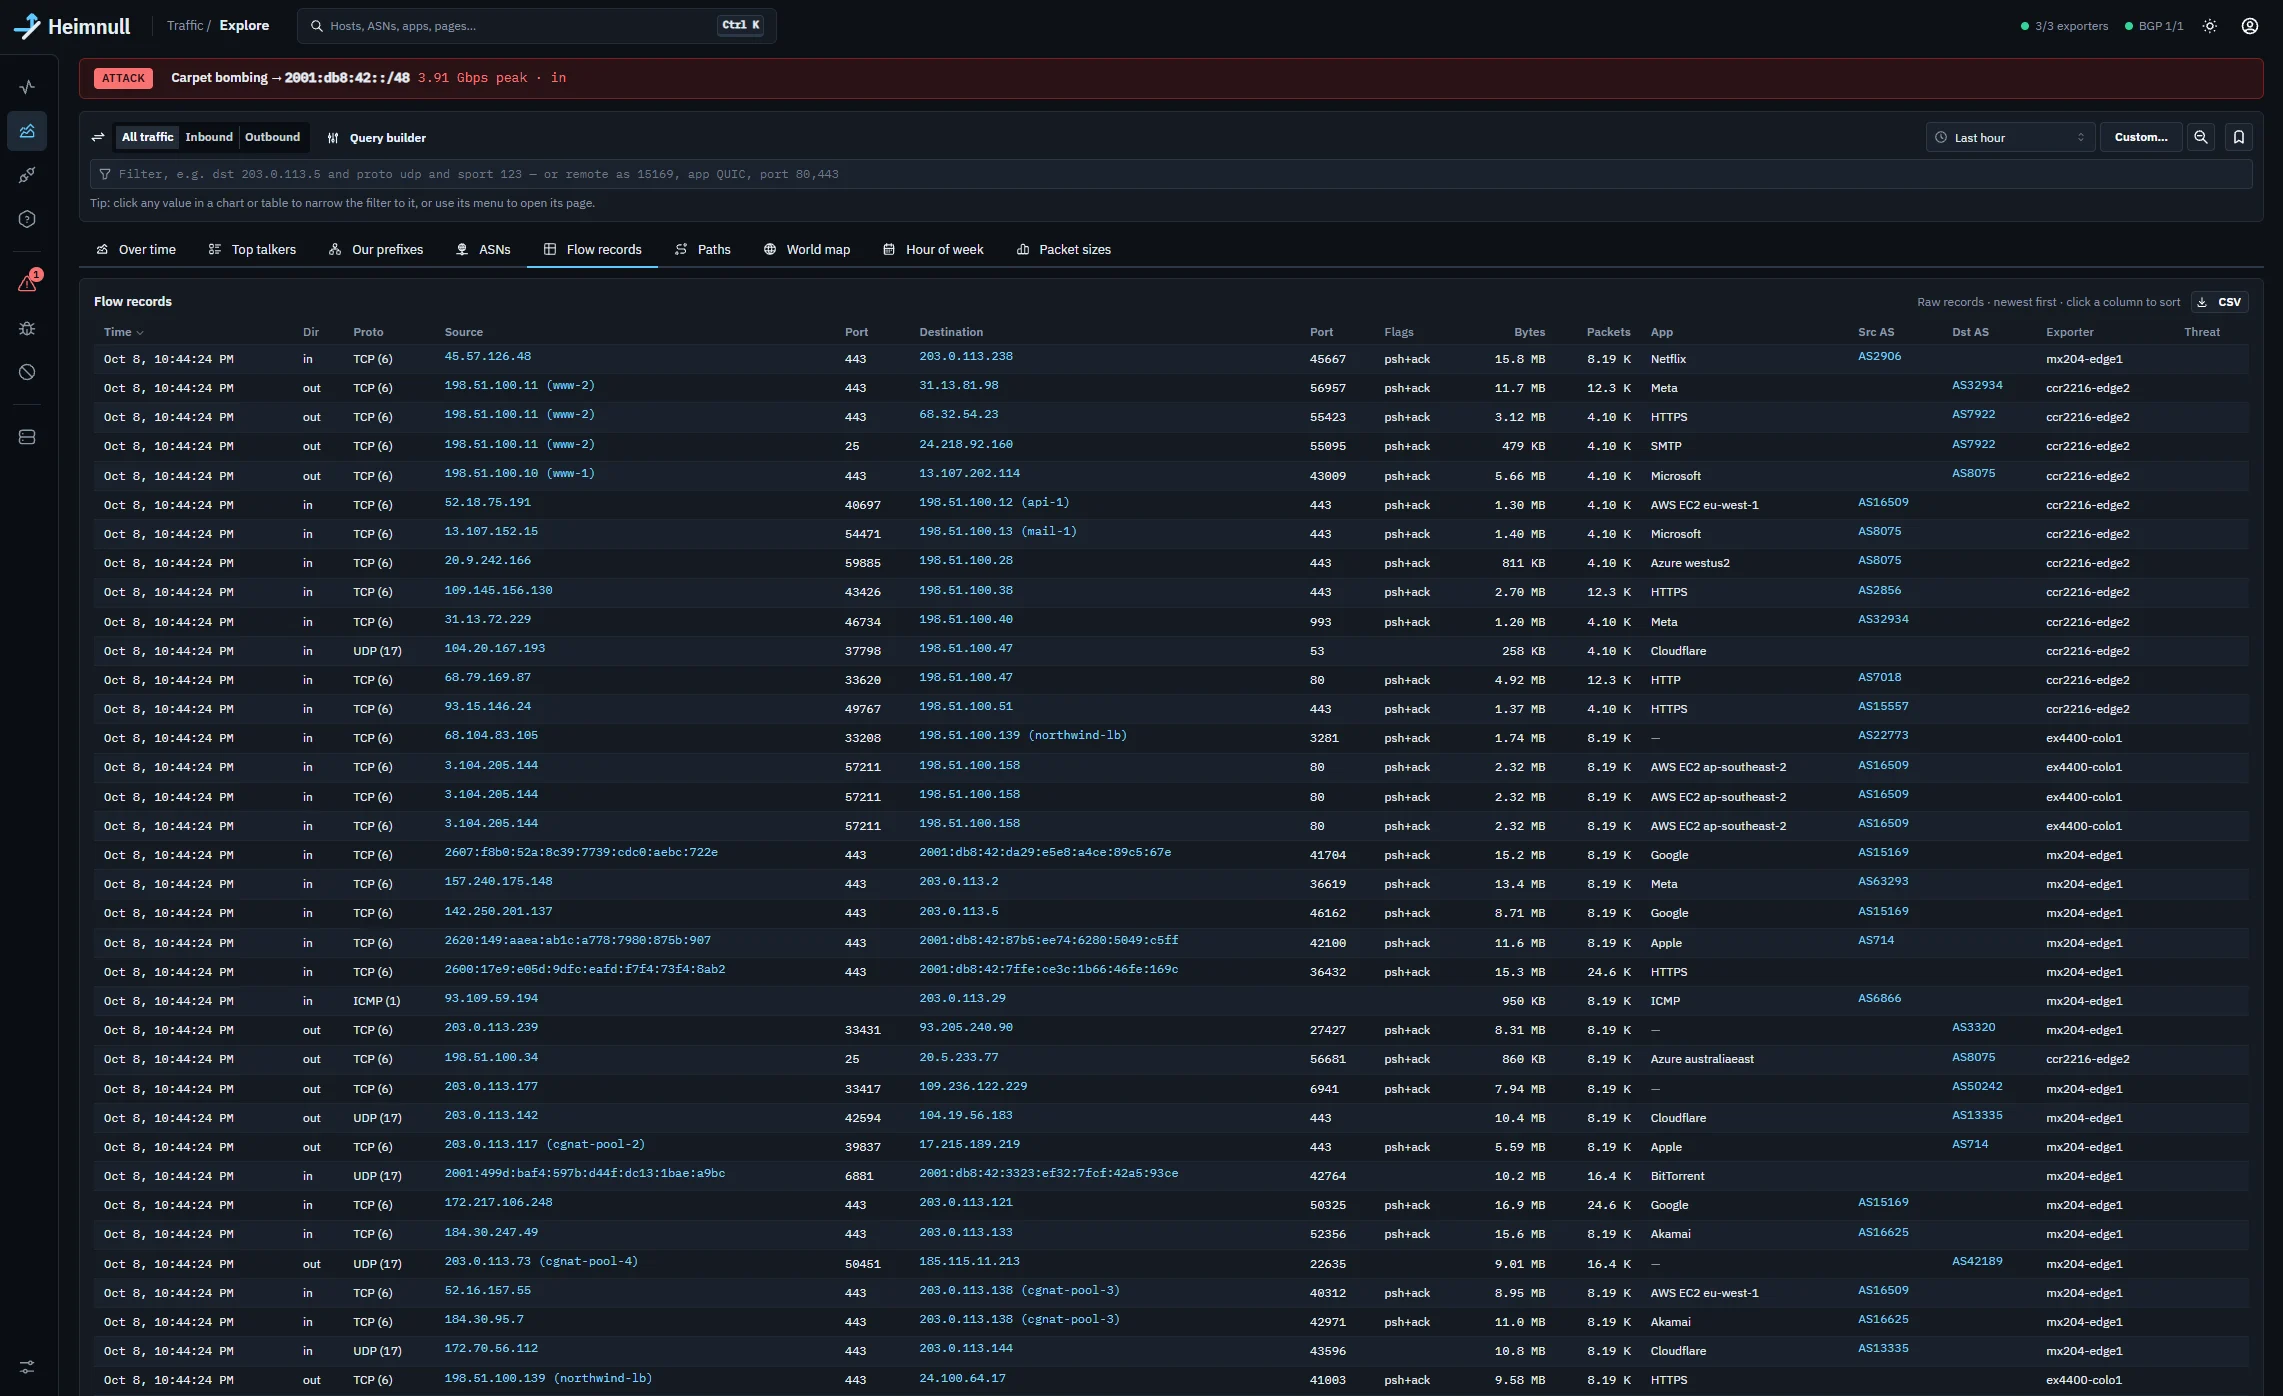
When a chart isn't enough, the raw records are there: time, direction, protocol, addresses, ports, TCP flags, bytes, packets, application, ASNs and the exporter that saw each one, with the host names you've given your addresses.
Sort by any column and export exactly what you're looking at as CSV.
Built for real flow rates
Decoding, enrichment and detection run in memory, and nothing on that path waits for a database. Flows are written to ClickHouse in batches, and every query picks the right rollup, from one minute to one hour, for its time range.
| Load test, 10 minutes | Result |
|---|---|
| Records sent | 59,934,930 from four exporters (IPFIX and NetFlow v9, sampled 1 in 500): about 100,000 a second |
| Records stored | 59,934,930: every one, with no drops at any stage |
| Storage | About 56 bytes per record, compressed |
| Detection | A SYN flood started halfway through was recorded 5.0 s after it began, while about 100,000 hosts were tracked |
The test ran on a 12-core development machine with the traffic generators on the same host, so treat it as a guide. A production server is sized at 8 cores and 16 GB; 4 cores and 8 GB work at lower flow rates.
Questions
Do I need unsampled flow data?
No. Sample at whatever rate your hardware supports, and Heimnull scales it. On a small link a higher rate, such as 1 in 100, gives smoother per-second figures.
Which routers and switches does it work with?
Anything that exports NetFlow v9, IPFIX or sFlow v5. Setup guides cover the Juniper MX, EX and SRX, and MikroTik RouterOS 7.
Can I use it just for traffic analysis?
Yes. BGP isn't needed for analytics, and DDoS detection only notifies until you choose to let a hostgroup send FlowSpec rules or blackholes.
Where is the data kept?
On your server. Heimnull runs in Docker with Postgres and ClickHouse beside it, and both listen on localhost only.
What does it run on?
Debian 13 on amd64 or arm64, with Docker and its compose plugin and SSD or NVMe storage.
Related
See it on real traffic
The demo runs the full console on made-up traffic, with attacks and mitigations to click through. To try Heimnull on your own network, write to us.
info@heimnull.com